Pixel Neighbors, Average Color Value, and Attempted Edge Detection
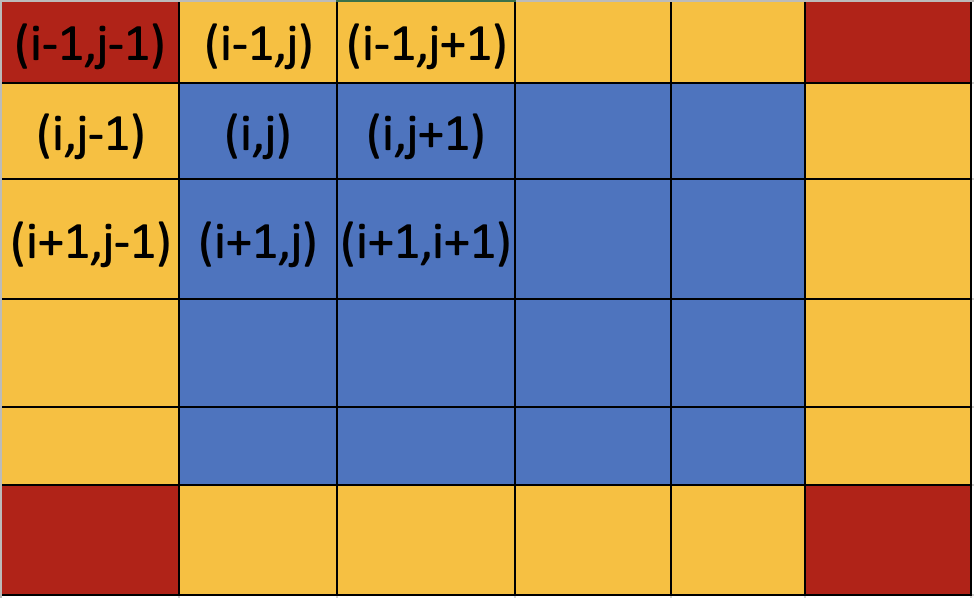
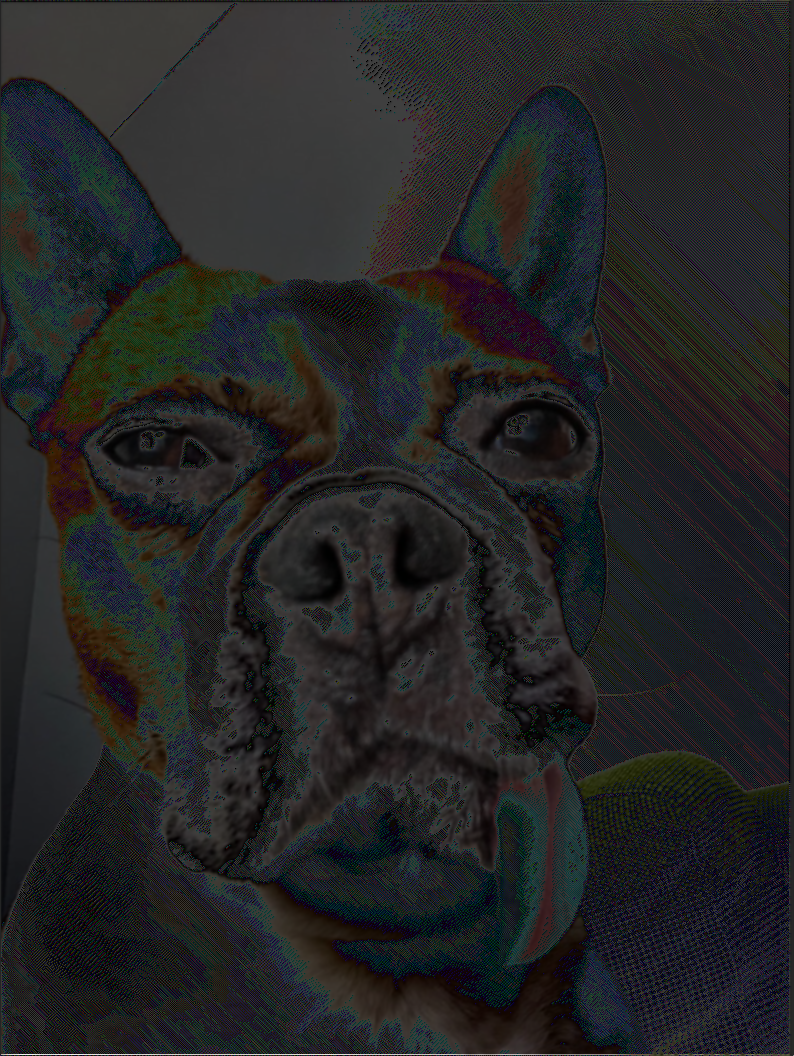
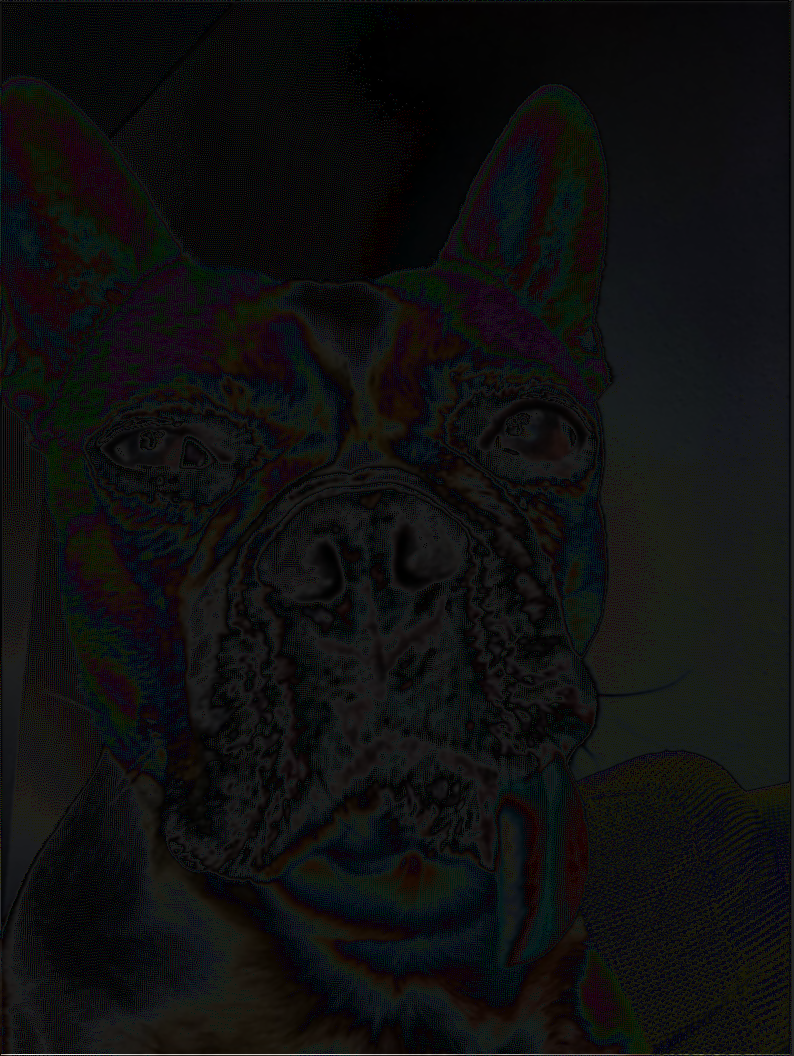
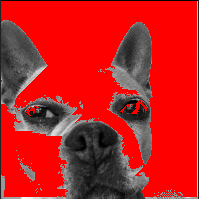
The purpose of this section was to find the neighbors of each pixel in given image. Part of the implementation was to select either adjacent neigbors (above,below,left,right) or all neigbors (above,below,left,right, and both diagonals). Upon finding the surrounding pixels, the average color of all neighbors was computed and then assigned to the central pixel. The result is a unique coloration of the image. Now, while coloring the image was a biproduct of finding a pixel's neighbors, this can be expanded to perhaps n neighbors in each direction or to iterating through an image in a different way. Using a pixel's neigbors, I attempted to find edges (or places of sharp color contrast) using the 2-norm between any two points. This however did not work as expected but still proved to be an interesting task. Perhaps using a different norm (1,infinity,0,etc) would yeild different results.
Process for Finding Neighbors
- 1. Read in our image using PIL, convert it to a numpy array, and scale it down to speed up the process of the algorithm
- 2. Find the dimensions of the image in order to iterate through its entirety
- 3. Select either adjacent or all neigbors
- 4. Begin iterating through the image
- - note: refer to the figures to see how different pixel locations contain a different number of neigbors
- 5. Compute the average color at each location and set that value as the new pixel value
- 6. Use plt.imsave from matplotlib.pyplot to save our resulting image
Examples
Process for Edge Detection Attempt
- 1. Read in our image using PIL, convert it to a numpy array, and scale it down to speed up the process of the algorithm
- 2. Convert the image to grey scale in order for each pixel's rgb values to be equal (ex. (.5,.5,.5)).
- 3. Find the dimensions and begin iterating through the image
- 4. At each location, compute the adjacent and diagonal neigbors and combine the two arrays
- 5. Again, at each location, compute an array derived by applyting the 2-norm (or distance) between the respective location's color value and each of its neighbor's color values
- - note: the distance is referencing how much a color is different from another based on all three color channels.
- 6. If any element in our new array exceeds a chosen contrast, color that location red.
- 7. Save our resulting image using plt.imsave from matplotlib.pyplot
Example
Tools Used